Average operating time until the first failure occurs.
MTTF = (Available time − Downtime) / Number of failures 
Below are the basic metrics that can be reported in the system. SimplyMobile CMMS also allows you to create custom reports and summaries for other metrics. It’s crucial to choose the right filtering and grouping when calculating metrics—for example, computing a metric for a group of assets or only for assets in a specific department. SimplyMobile CMMS offers extensive filtering and grouping capabilities for quick verification of the metrics listed below.
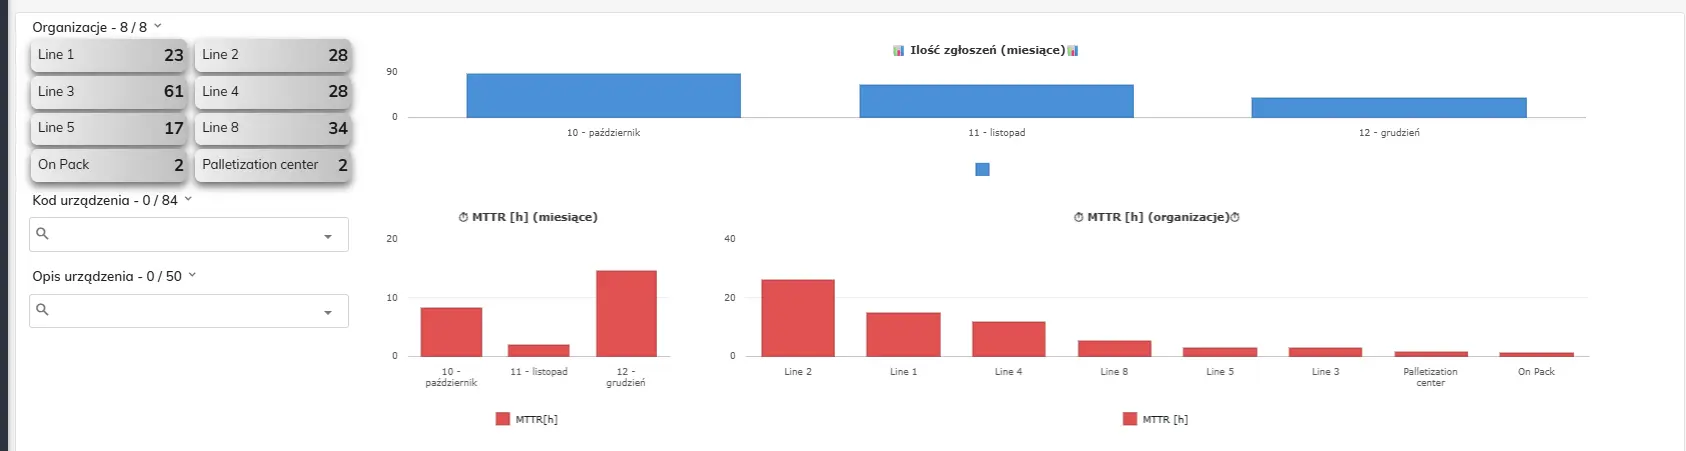
A metric's value depends on context, so SimplyMobile lets you calculate it for a selected department, asset group, production line or a single machine, over any time range. You can group and filter the same data in many ways to compare periods, shifts and locations, and quickly get to the root causes of deviations.
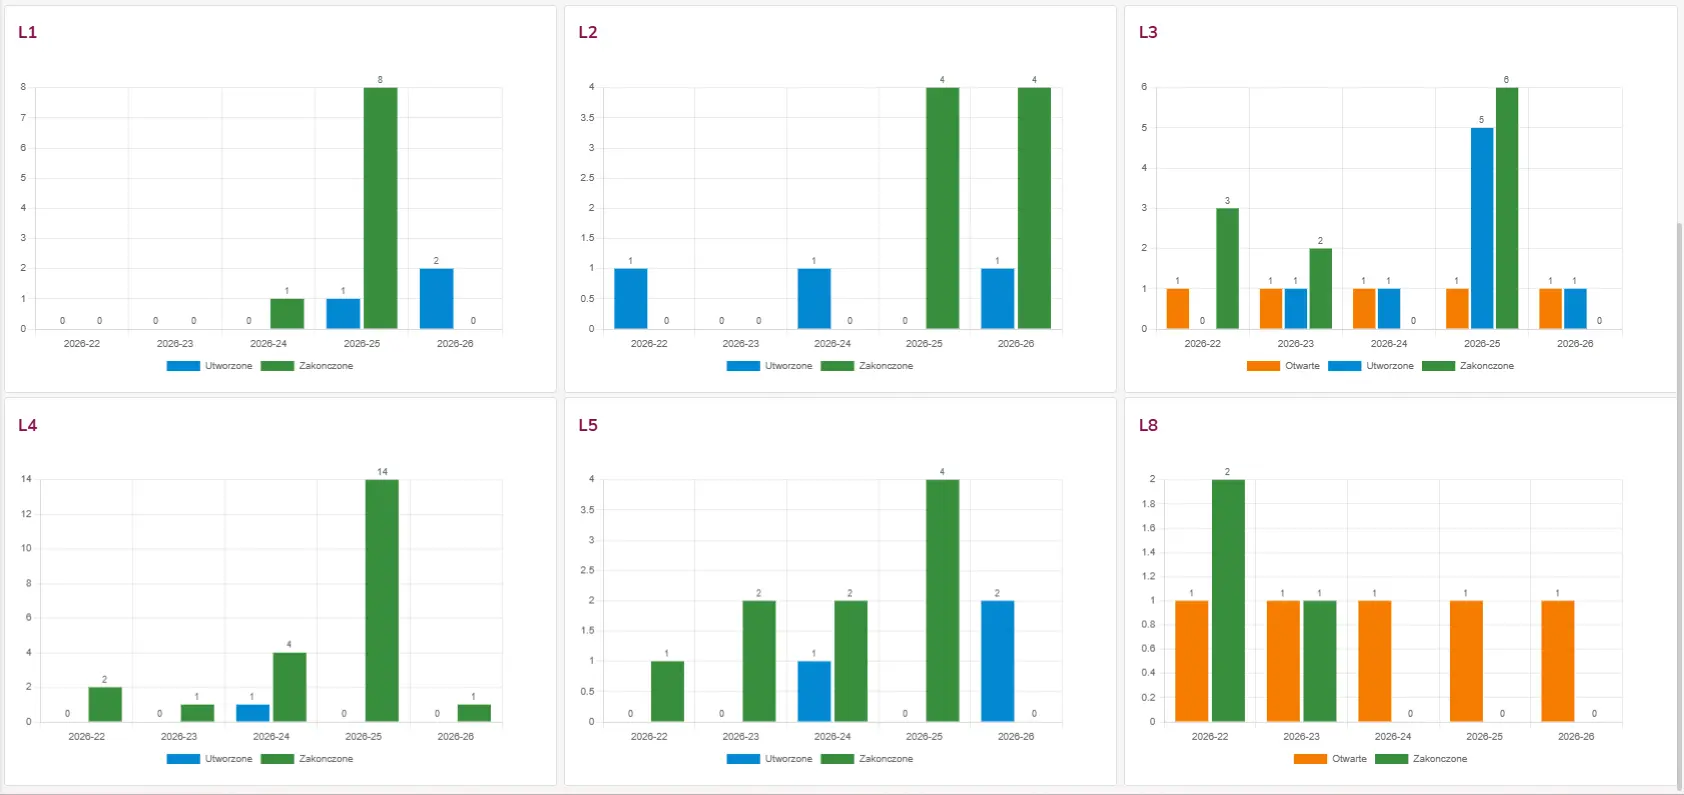
Average operating time until the first failure occurs.
MTTF = (Available time − Downtime) / Number of failures Average time from a failure to the completed repair.
MTTR = Total repair time / Number of repairs Average uninterrupted operating time between failures.
MTBF = MTTF + MTTR Effectiveness from three factors: availability, performance and quality.
OEE = Availability × Performance × Quality Defines the average time a device operates before the first failure occurs. The higher the MTTF, the more reliable the device.
In CMMS maintenance systems, it is most often calculated as:
(Available operating time − Downtime) / Number of events [min]
Available operating time – the scheduled time when the machine is expected to be available for production; if no schedule exists, defaults to 24/7.
Downtime – the period during which production was scheduled but the machine was unavailable due to a failure. Periods where a failure occurred but no production was scheduled are excluded.
Example: with 600 h of available time, 20 h of downtime and 4 events: (600 − 20) / 4 = 145 h on average to failure.
Why it matters: assessing machine reliability, planning inspections and comparing devices of the same type.
Note: calculate MTTF for a consistent group of assets and a single period — mixing different machine types distorts the result.
Defines the average time from the occurrence of a failure to restoring the device to operation. The lower the MTTR, the more efficient the maintenance team.
Most often calculated as:
Total repair time / Number of repairs [min]
Repair time usually includes diagnosis, waiting for parts, the repair itself and testing — that is, the full time the machine is unavailable due to the failure.
Example: 5 repairs lasting 600 min in total give an MTTR of 120 min (2 h).
Why it matters: evaluating service efficiency, planning spare-part stock and identifying machines that cause the longest downtime.
Note: a high MTTR often results from waiting for parts rather than the repair itself — it’s worth separating these times in reports.
Defines the average uninterrupted operating time of a device between consecutive failures. A higher MTBF means greater reliability.
MTBF is calculated as the sum of the mean operating time and the mean repair time:
MTBF = MTTF + MTTR
MTBF covers the full cycle: operation up to the failure and the time needed to fix it.
Example: for MTTF = 145 h and MTTR = 2 h: MTBF = 147 h between failures.
Why it matters: forecasting failure frequency, setting preventive-maintenance intervals and reporting reliability.
Note: MTBF applies to repairable equipment; for single-use components, MTTF is the right metric.
Measures the overall effectiveness of equipment utilization by combining three factors: availability, performance and quality.
OEE = availability × performance × quality
availability – the share of actual operating time within scheduled time (accounts for failures and changeovers).
performance – the ratio of actual to nominal production speed.
quality – the share of good units in total output.
Example: availability 90% × performance 95% × quality 99% ≈ 85% OEE.
Why it matters: a single metric showing how much real, good output a machine delivers relative to its full potential.
Benchmarks: ~85% is considered world-class, around 60% is typical, and below 40% indicates significant room for improvement.
Book a free, no-obligation demo — we'll show the system on your own processes.